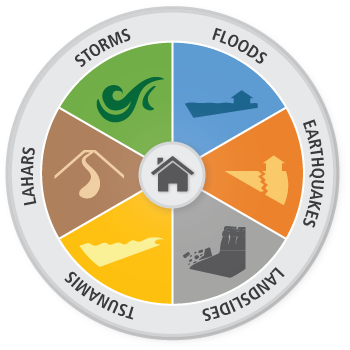
Risk MAP provides information about the risk posed to Washington counties by floods, earthquakes, earthquake-triggered events (liquefaction and tsunamis), and lahars.
Risk Mapping in Washington
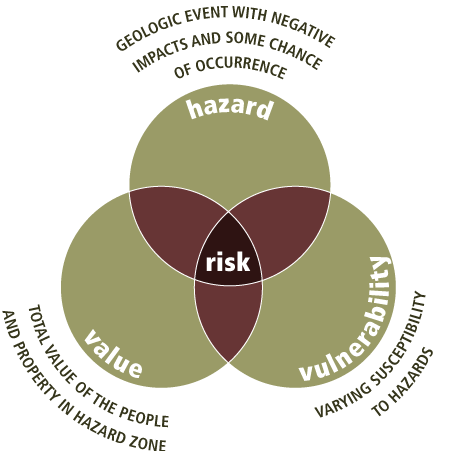
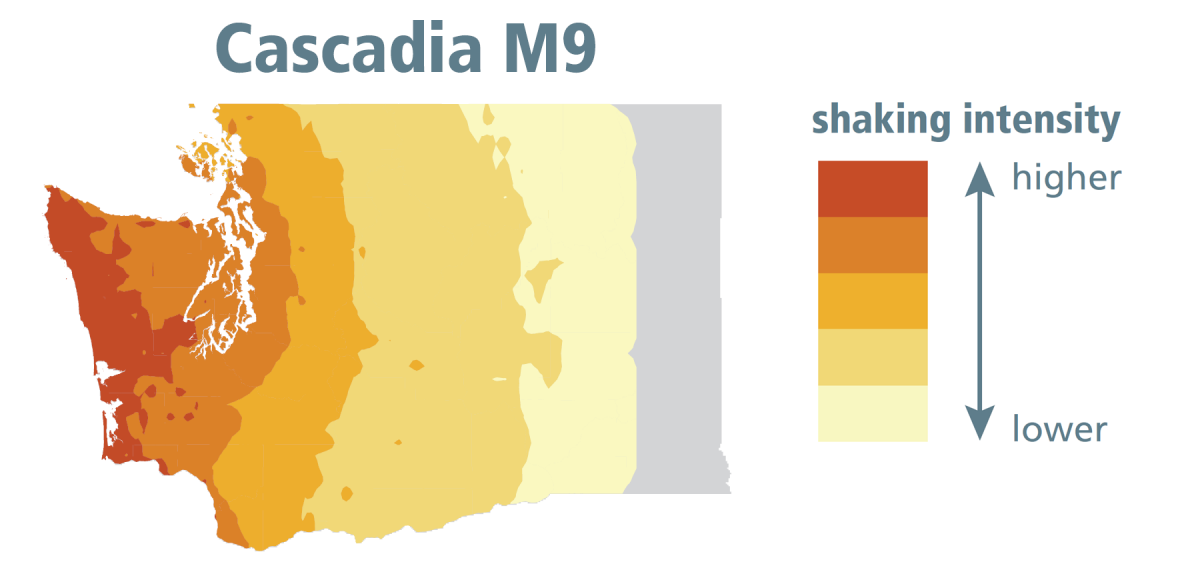
Risk is a combination of hazard (magnitude of geologic event), vulnerability (degree of susceptibility), and value (an economic measure of property and livelihoods at risk). Loss estimation models are used to assess damages at any given location in a county or community based on modeled hazard scenarios, such as a magnitude 9.0 earthquake on the Cascadia subduction zone, or a 100-year flood event. The Washington Geological Survey (WGS) conducts this work using a loss estimation tool known as Hazus, under the Risk MAP program developed by the Federal Emergency Management Agency (FEMA).
What is Risk MAP?
Risk MAP stands for Risk Mapping, Assessment, and Planning. The objective of the program is to provide information about natural hazard risk to communities, tribal and local governments, and state agencies. The program coordinates modeling efforts and communication of results to responsible parties, such as emergency managers. The objective of this effort is to minimize losses when natural disasters strike.
What is Hazus?
Hazus is a loss estimation modeling tool developed and distributed by FEMA. The tool is developed for flood, earthquake, and hurricane hazards. It has recently been expanded to support tsunami hazards.
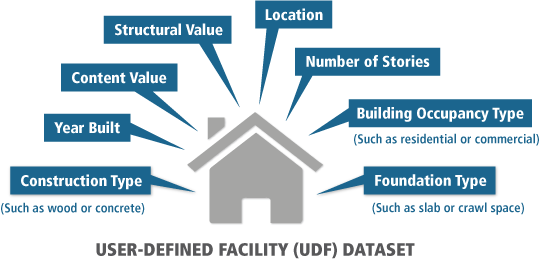
Hazus users can prepare inputs for local conditions (for example, local soil type, liquefaction susceptibility, and building-specific information such as year built, building value, building type, building square footage, building foundation type, and number of stories), allowing them to estimate damages from floods and earthquakes with higher accuracy. The tool is then used to model loss estimates for structural and nonstructural damage probabilities.
For earthquakes, the model outputs damage probability, ranging from no damage to complete damage. This model is based on shaking intensity and building-specific damage probabilities. For floods, damage is estimated using coastal and (or) riverine depth (inundation) grids as well as flood-specific building properties.
These basic model outputs can be used to calculate derivative products such as total value lost or loss ratios (loss relative to original value). The resulting maps help emergency managers understand spatial controls on the physical and economic impacts of natural disasters in their communities.
How is the Washington Geological Survey contributing?
The Department of Ecology (ECY)is the State’s Risk MAP coordinator. The department is tasked with assessment of flood risk in Washington’s coastal and floodplain areas. Specifically, their role is to produce Flood Insurance Rate Maps (FIRM) for regulatory purposes.
WGS focuses on the non-regulatory aspects of Risk MAP projects. The Survey conducts Hazus-based estimations of building damage from floods and earthquakes (not including dams, roads, bridges, and other infrastructure). WGS also analyzes building exposure to liquefaction, tsunami, and lahar hazards. Making these damage estimates requires hazard maps and building information. Some of these datasets are provided by external sources while others have been developed or expanded by WGS.
Hazard Information
Earthquakes
Earthquake hazard maps are developed using a ‘ShakeMap’, which shows the degree of shaking any location in Washington will experience if an earthquake occurs. This dataset is provided by the U.S. Geological Survey. ShakeMaps for earthquake scenarios and actual past major earthquakes specific to Washington can be found on the WGS Geologic Information Portal. Buildings exposed to liquefaction hazard are used to estimate possible additional damage by earthquake-triggered events. Liquefaction and soil shaking maps are also available on the Geologic Information Portal.
[Read more]
Floods
Flood damage assessments require flood depth grid datasets. These grids are supplied by FEMA Region 10 and are available from ECY. Two types of depth grids are available—riverine and coastal. Depth grids indicate the depth of water at any given point following a flooding event. Combined with building foundation type and first floor elevation information, these datasets can be used to assess potential damage to buildings.
Tsunamis
Damage from tsunamis is assessed using tsunami inundation maps. Tsunami inundation zone information can be downloaded from the WGS Geologic Information Portal. For tsunami risk assessment, the building data are mapped within the tsunami inundation zones generated by a Cascadia magnitude 9.0 earthquake model, or other crustal fault models. WGS is continuing to develop inundation models for a Cascadia subduction zone earthquake and other potential earthquake events such as for the Seattle and Tacoma faults.
Lahars
Lahar hazard maps used in the Risk MAP assessment for volcano hazards can be downloaded from the WGS Geologic Information Portal and from the USGS website.
Building Information
An important model input when calculating damage is building information. The standard Hazus output is based on aggregated building inventory data lumped by census tracts and blocks. The size of these blocks is dependent on population and each block may cover many different parcels, containing many buildings with different properties and values. This limits the usefulness of the model for small communities that require the greater detail offered by building-level analysis.
In order to better estimate earthquake vulnerability, the Survey has worked with FEMA, ECY, county assessor’s offices, and other state agencies to acquire and update a detailed collection of building information. This input to Hazus is known as a User-Defined Facility (UDF) dataset. The UDF point data generally represent the centers of building parcels and include available physical and value information about each building—when it was built, type of foundation, number of stories, occupancy type (such as residential commercial, or industrial), and its estimated economic value. Damage can therefore be estimated for each individual building. The UDF datasets for counties we have worked on were created from scratch by WGS and are not available from ECY.
In addition to this, the UDF dataset was used to update inventories of essential facilities used in the Hazus modeling (for example, fire stations, police stations, medical facilities, and schools). Hazus includes a list of essential facilities, but this list is not locally up-to-date. To create an updated list of essential facilities specific to the relevant counties, WGS compiled information from the UDF, the Washington Department of Health (DOH), the National Center for Education Statistics, and the Hazus national database. The WGS-prepared UDF is derived from sources such as county assessors’ office records, lidar footprints, GoogleEarth, and other online data. This essential facility update can then be used to more accurately determine which of these facilities may be functional following a natural disaster, such as a major earthquake or flood event.
The Survey’s contribution to Risk MAP is valuable to community planners and emergency managers making local, site-specific decisions, and who are preparing or updating their mitigation plans. WGS has generated these new building-specific Hazus results, rather than the original census-based aggregated building data (known as the general building stock), for 11 counties (Grays Harbor, Pacific, Jefferson, Clallam, Mason, Okanogan, Whatcom, San Juan, Chelan, Island and Skagit).
Where can I find more information?
|
This webpage complements material produced by other state and federal agencies. ECY, in cooperation with FEMA, is tasked with coordinating the Risk MAP program for the State of Washington. An interactive story map on the ECY website provides more information about Risk MAP as well as full reports for each of the counties mentioned above. Download the Risk MAP reports here. Additional data relating to natural hazards in Washington, can be found on the WGS Geologic Information Portal. For information about the WGS UDF risk database described on this page, contact Corina Forson, Washington Geological Survey, corina.forson@dnr.wa.gov. |