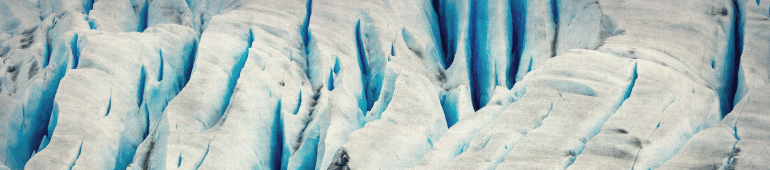
What are glaciers?
Glaciers form in areas where snow accumulation persists through time, allowing the snow to pile up and compact into ice. It typically takes hundreds of years for a glacier to fully form into a mass of ice. Glaciers behave like rivers of ice, moving, growing, and shrinking over time. They are bounded by the valleys that they reside in, but they flow under the force of gravity, and they also advance and retreat depending upon the climate conditions (how much snow accumulates versus melts in a given year).
Where can glaciers be found?
Certain types of glaciers, known as alpine glaciers, form at high elevations in mountains, places where temperatures are often persistently cold and where snow falls regularly. Alpine glaciers flow downhill. There are also very large glaciers that are known as ice sheets that extend over areas of at least 19,000 square miles. This is about the size of the state of West Virginia or Vancouver Island! Ice sheets are so large that they obscure the topography they lay on, and they flow outward from their center. Today, ice sheets can be found in Antarctica and Greenland, though in the past ice sheets were also present in North America, and they contributed to the creation of Washington State as we know it today.
Read the sections below to learn more about the different types of landforms that glaciers leave behind, the history of large ice sheets in Washington and the periodic floods associated with them, more about alpine glaciers, what that future of glaciers in Washington might look like, and more resources about glaciers.
 Glacial landforms |
 The Cordilleran ice sheet |
 The Missoula Floods |
 Alpine glaciers |
 Future of Washington glaciers |
 Glacier fun |
Glacial Landforms
Glaciers and ice sheets have tremendous power to drastically transform landscapes over relatively short periods of time. Most glacial landforms in Washington are the result of ice sheets.
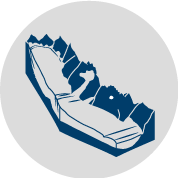
Lidar enables us to see these landforms in fine detail. Click on the features on the map below to see what kinds of features the ice left behind. There are also many other glacial landforms, some of which are found in Washington. For more information about glacial landforms, check out this page from the National Park Service.
Get the Poster

|
Glacial Landforms of the Puget Lowland Daniel E. Coe Georeferenced PDF |
The Cordilleran Ice Sheet
- Glaciations
- The Vashon Stade
- Glacial Lakes of the Puget Lobe
-
Over the last several million years, ice sheets have repeatedly inundated northern Washington. The last glacial climatic interval was called the Fraser glaciation, which sculpted much of the topography we see today in the Puget Lowland and northern Washington. These glacial periods were interrupted by warmer nonglacial climatic periods.
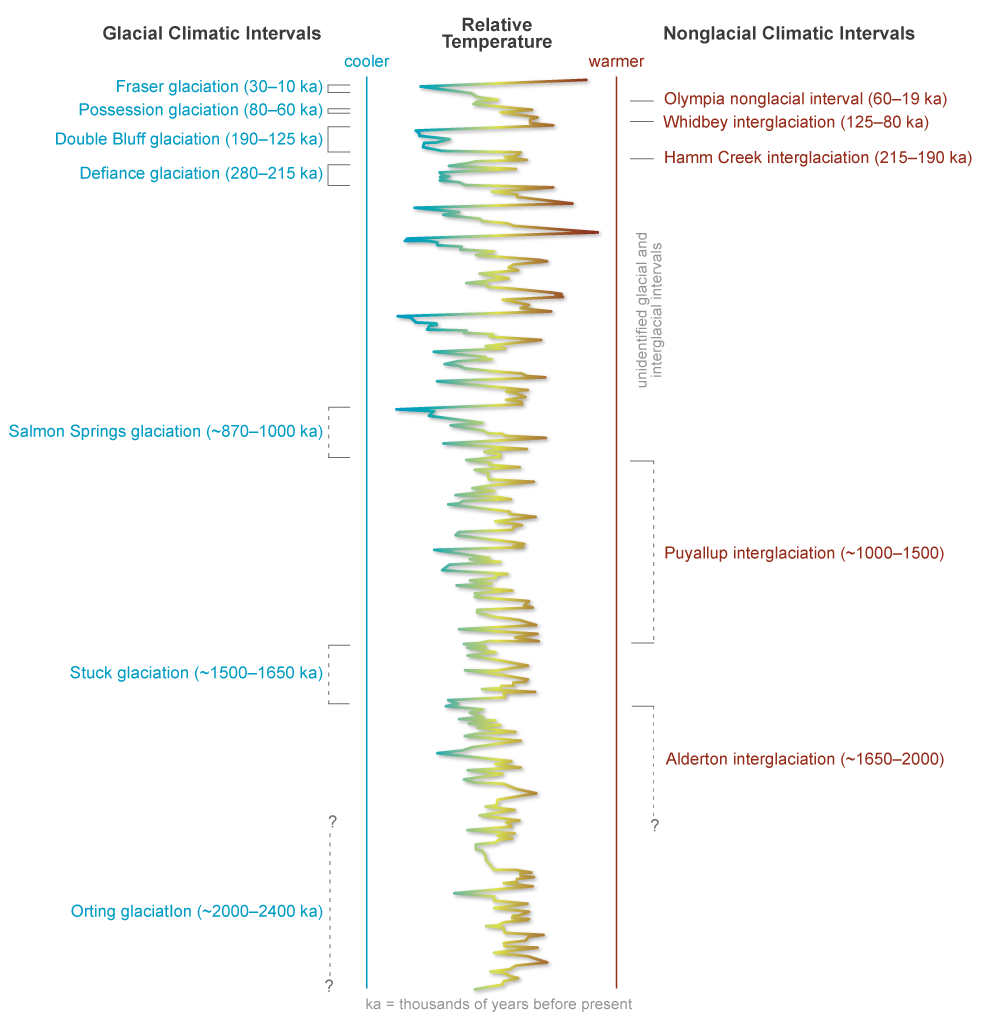
The figure above shows how local glaciations correlate with the climate changes during the last 2.4 million years.
How Do Scientists Determine Past Climate?
Scientists are able to figure out what the climate was like so long ago by drilling really deep cores into thick Antarctic ice and the sea floor all over the world. After removing these cores, they study thin slices under microscopes, examining microfossils, microbes, minerals, magnetic orientation, and rock type.
Microfossils
Paleontologists look for microfossils called foraminifera to tell us more about past ocean temperatures and climate. These creatures prefer warmer oceans and create their shells out of calcite. Scientists measure the ratio of Oxygen 16 to Oxygen 18 in calcite shells, and can use these ratios to estimate past climate conditions.
Ice and Seafloor Cores
Scientists study ice cores by analyzing the light and dark rings on the cores. These rings are created by snow capturing dust and dirt as it falls to Earth. Snowfall is higher in the winter than in the summer resulting in thicker rings. In the summer, it begins to melt creating a different composition and texture before refreezing again in winter. As the ice freezes, it traps air bubbles, which scientists also study and determine prehistoric climates from using oxygen ratios just like in sediment core samples.
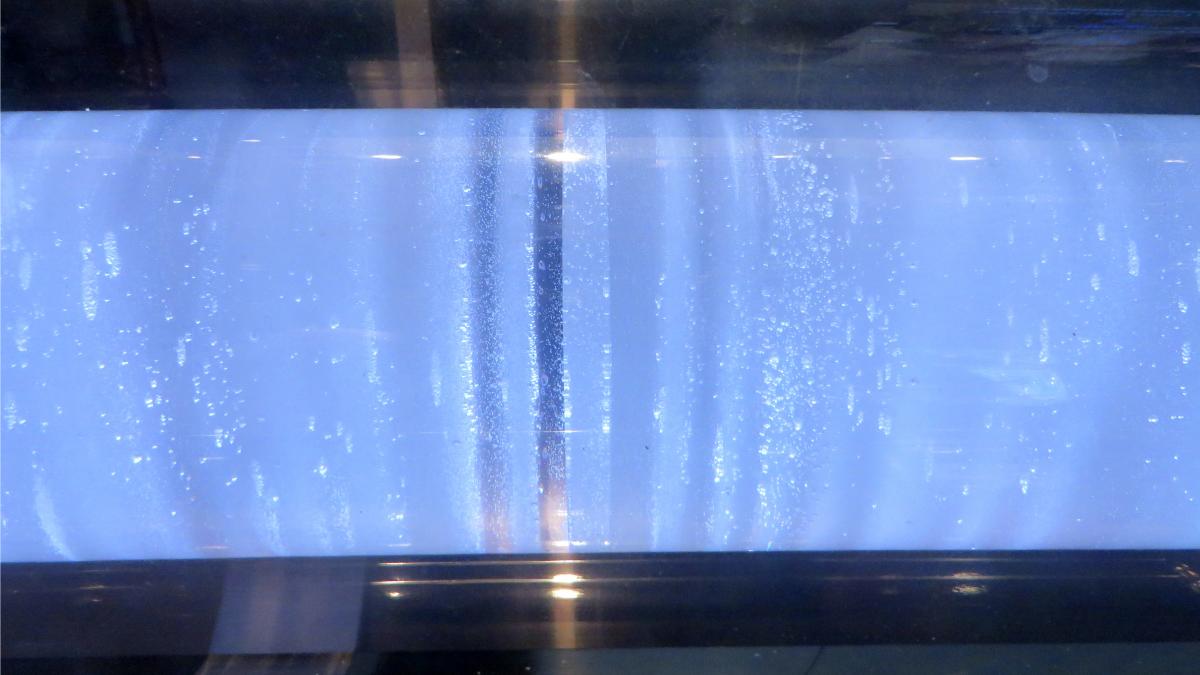
Photo of ice core, by Janine and Jim Eden, Flickr Creative Commons license.
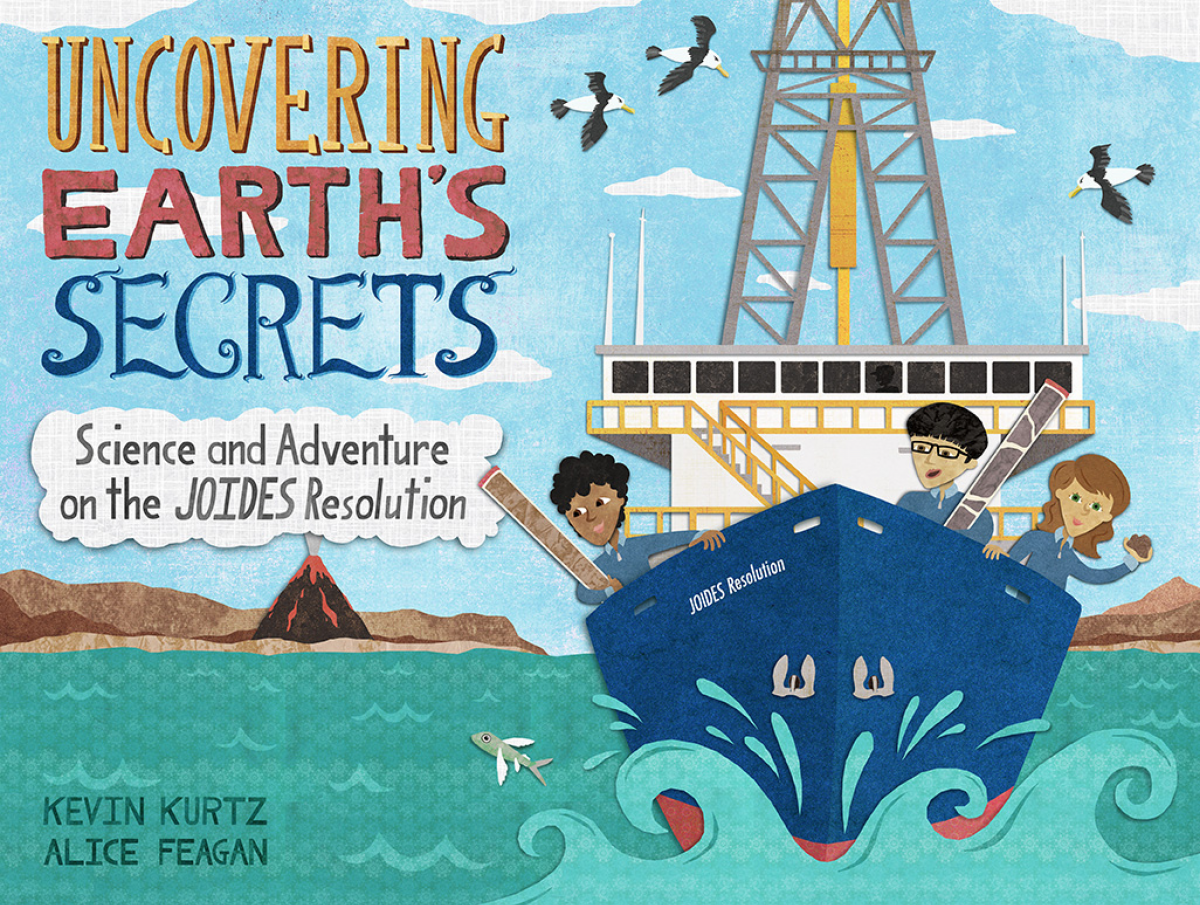
Understanding Earth's Secrets, by Kevin Kurtz and Alice Feagan is a great resource for young scientists to learn about microfossils and ice core drilling. Click the image to download the pdf!
-
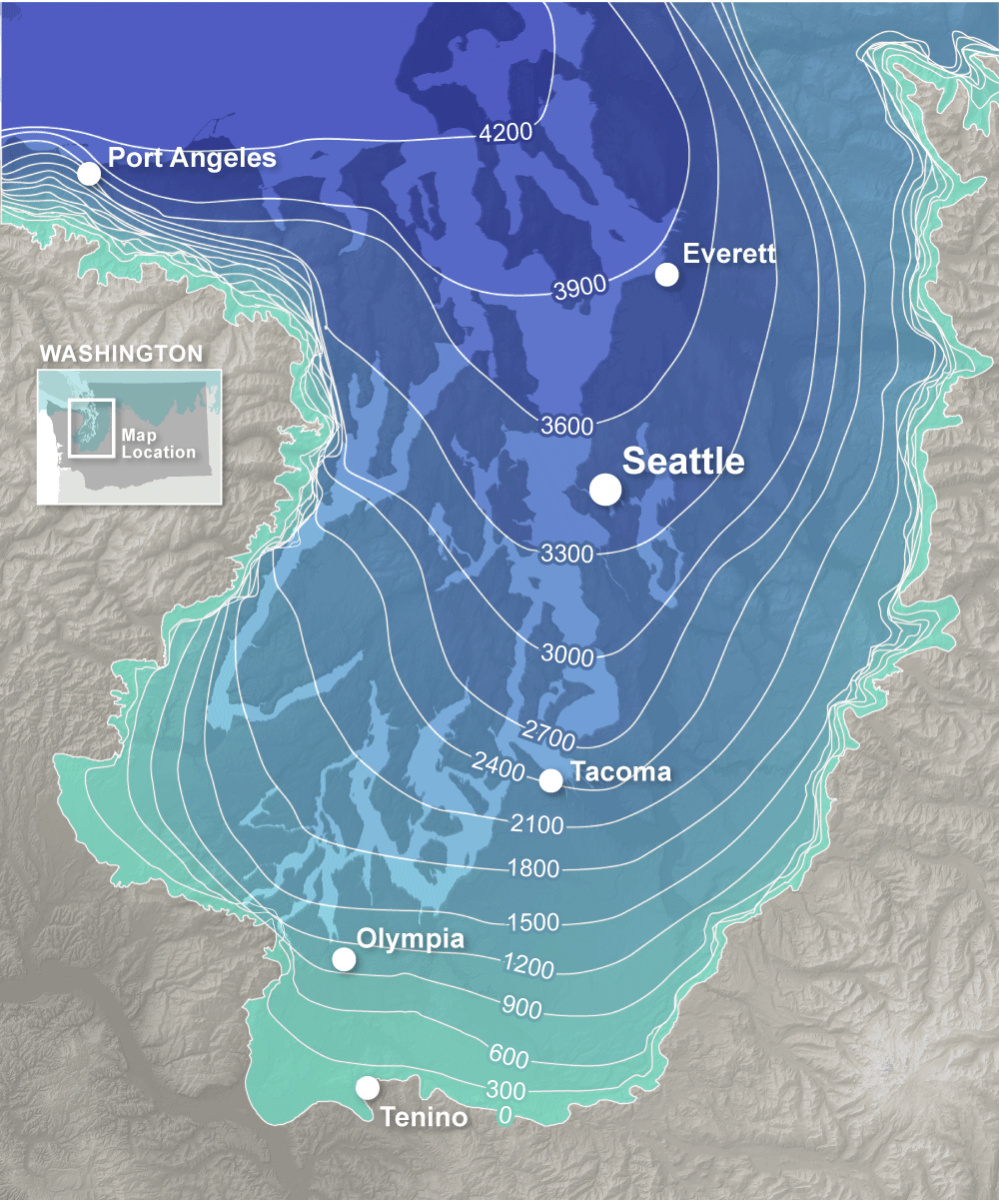
The Vashon Stade, part of the Fraser Glaciation was the latest major incursion of ice into the Puget Lowland. Ice advance as south as Tenino, WA, and was upward of 4,200 feet thick in the northern Puget Lowland.
Contours show approximate ice thickness in feet at glacial maximum during the Vashon Stade. Map derived from ice thickness contours by R. M. Thorson (1980).
The Whens, Wheres, and Hows of the Vashon Stade
So how do geologists determine when the glacier arrived at or left a certain spot? Use the interactive graphic below to learn more.
The Missoula Floods
- Ice-Age Flood Story Map
- More Resources
-
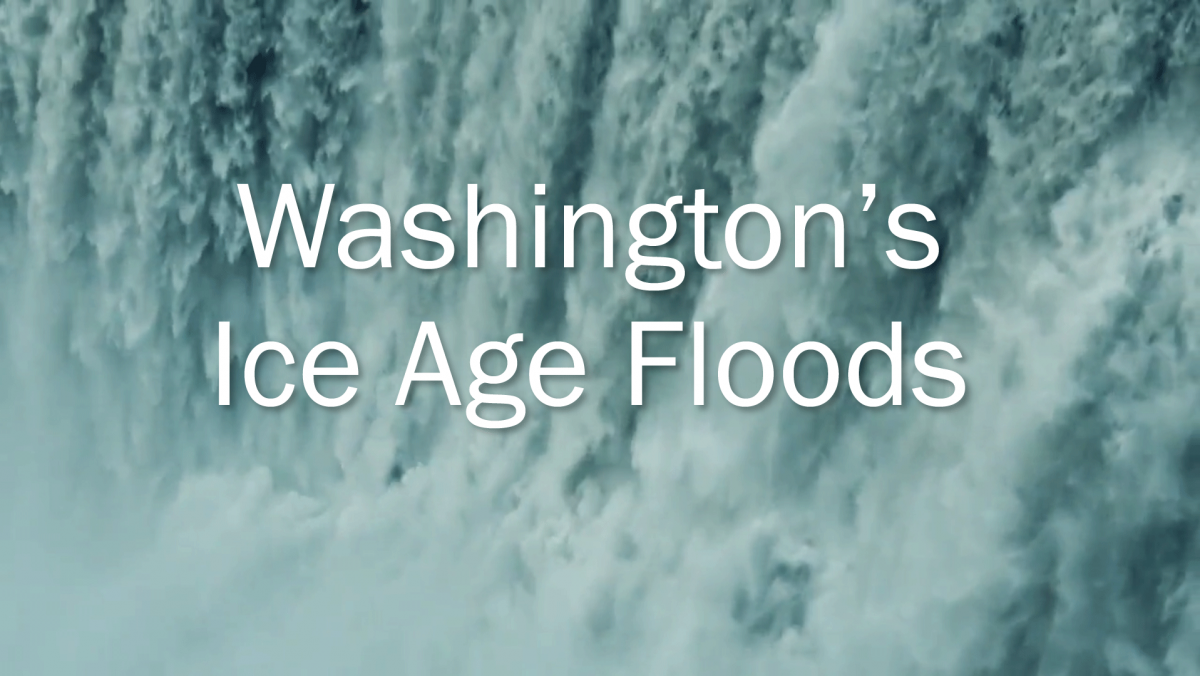
Click on the image to open our Story Map about Washington's Ice Age Floods. This Story Map is best viewed on a desktop or laptop computer. Mobile devices will not show all of the content.
Get the Posters
Ice Age Floods National Geologic Trail, Washington Section
Daniel E. Coe and Ashley A. Cabibbo
DNR Earth Science Week 2016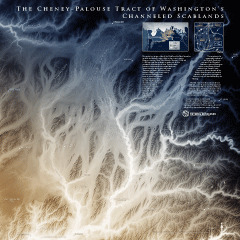
The Cheney-Palouse Tract of Washington's Channeled Scablands
Daniel E. Coe
-
Ice Age Floods National Geologic Trail, by the National Park Service
Alpine Glaciers
Anatomy of a glacier
Click on the feature labels to learn more about the parts of an alpine glacier.
Alpine glaciers in Washington
While ice sheets were a large part of Washington state’s history, today only alpine glaciers remain. Many mountainous areas across Washington are covered with alpine glaciers, and there are more than 3,000 alpine glaciers in Washington. Washington is the second most glaciated state in the U.S. after Alaska, and Washington’s very own Mount Rainier is the most glaciated mountain by surface area in all of the coterminous United States, being home to approximately 25 glaciers. For more information about the glaciers at Mount Rainier, check out this site from the National Park Service. Mount Baker is the second most glaciated mountain with 10 glaciers.
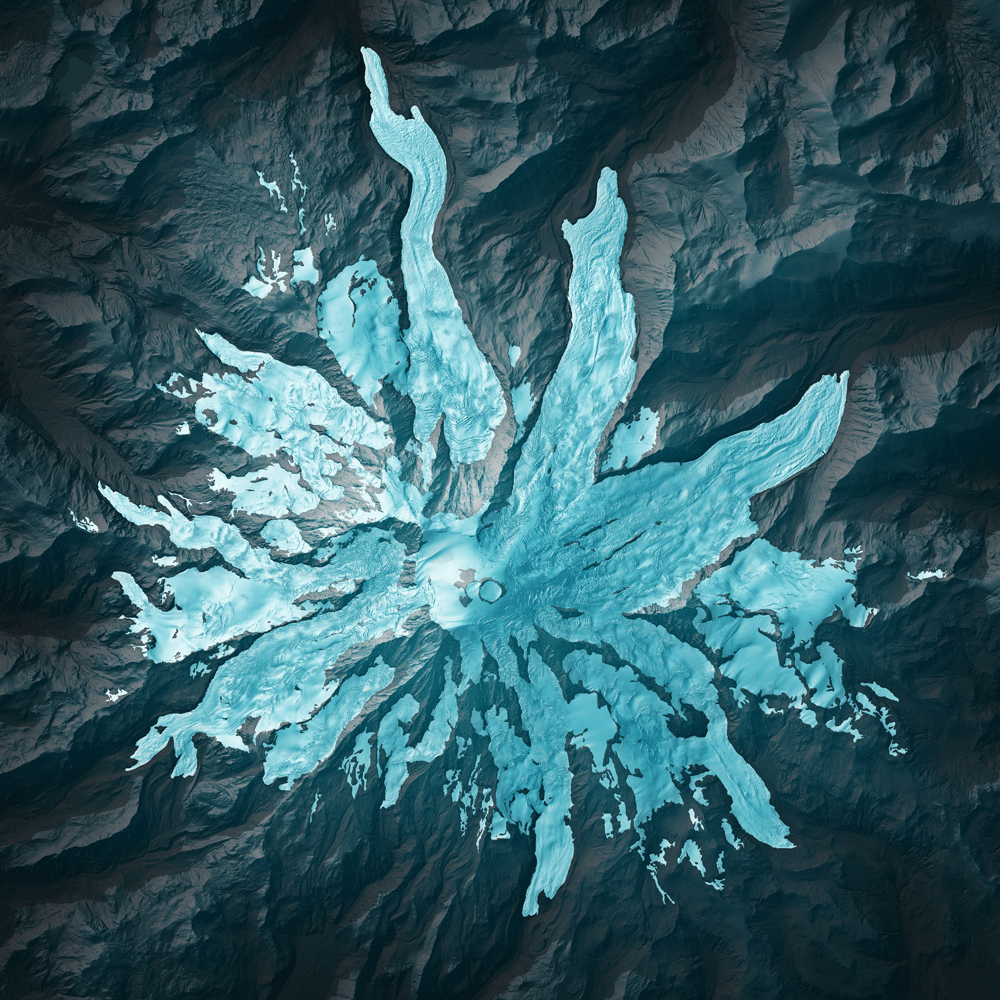
Lidar composite image of Mount Rainier's glaciers.
Other glaciated peaks include the volcanoes Glacier Peak, Mount Adams, and Mount St. Helens, but there are other tall peaks that host glaciers and are not volcanoes. For example, Mount Olympus, Mount Shuksan, Goat Rocks, and the Enchantments are glaciated. The map below shows the three main glaciated areas of Washington: the Olympics, the North Cascades, and the South Cascades. Click inside the rectangular inset areas in the map to open more detailed maps of the alpine glaciers.
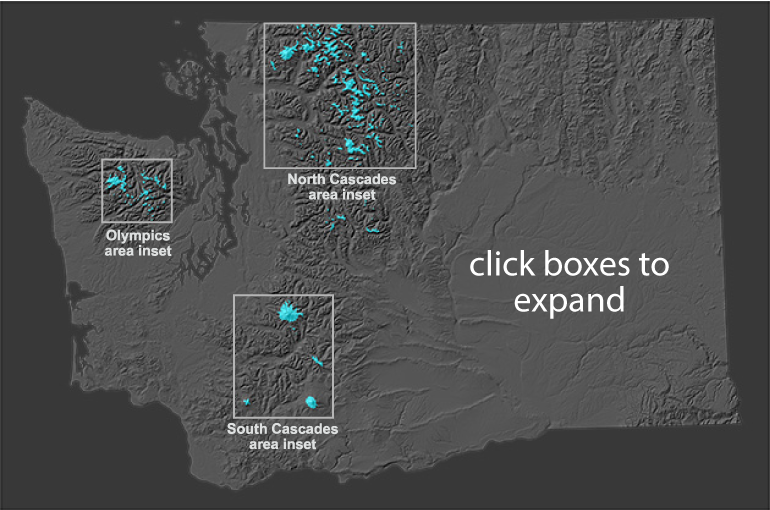
Map of Washington showing areas with alpine glaciers. Data from the Global Land Ice Measurements from Space Database. [GLIMS and NSIDC (2005, updated 2018): Global Land Ice Measurements from Space glacier database. Compiled and made available by the international GLIMS community and the National Snow and Ice Data Center, Boulder CO, U.S.A. DOI:10.7265/N5V98602].
Future of Washington glaciers
Although Washington currently has many glaciers, this may not always be the case. Most glaciers worldwide are melting, and have been for decades owing to long-term warming climate conditions caused by human activities. The rapid loss of these features can result in even further warming of our planet, since glaciers help cool our planet by reflecting sunlight. Glaciers are also a source of freshwater, and with further heating and drying conditions trending across the planet, water resources are getting slimmer. In addition, the melting of glaciers and ice sheets contributes more freshwater to our oceans, resulting in changes to thermohaline currents as well as rising sea levels. Sea level rise poses a threat to many low-lying coastal areas across the world, including in Washington.
Benchmark glaciers
One way scientists have been studying glacier change through time is by focusing on specific glaciers. The U.S. Geological Survey has taken detailed measurements and observations of five 'benchmark glaciers' since 1959. Three of the five benchmark glaciers are in Alaska, one is in Montana, and one is in Washington. Known as the 'South Cascade Glacier', Washington's benchmark glacier is located about 10 miles north of Glacier Peak. The South Cascade Glacier and all other benchmark glaciers have been dwindling since the beginning of detailed surveying in the 50s, and the South Cascade Glacier in particular is thinning by about 2 feet each year.
Graphic from the U.S. Geological Survey's South Cascade Glacier webpage.
Equilibrium line
One way to understand changes in glaciers is to look at the glacier's equilibrium line altitude ('ELA' for short). The ELA is the 30-year average of the snow line (see image below) that separates the glacier into two zones, one which is gaining mass (accumulation zone) and one which is losing mass (ablation zone). For a glacier to stay the same size, the ELA should stay fairly constant through time. If the ELA moves higher up the glacier, that means that more of the glacier is experiencing melting than it was before, and implies that the glacier will retreat. If the ELA moves lower down the glacier, that means that more of the glacier is gaining mass than it was before, and implies that the glacier will advance.
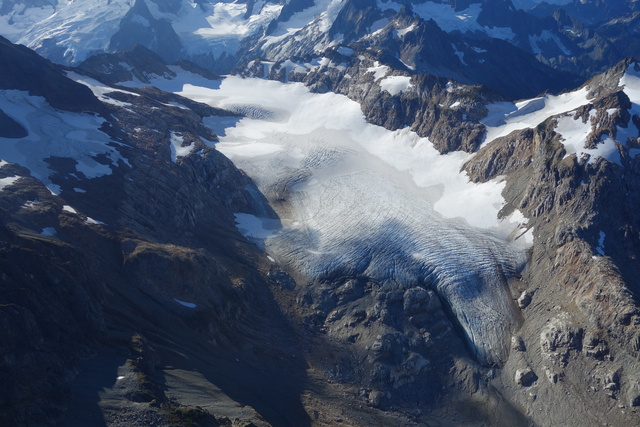
Image of the snow line at South Cascade Glacier. The snow line is the division between the gray shaded area on the glacier and the white area. Photo from: Bachmann, Matt, 2014. South Cascade Glacier: From the Glacier Photograph Collection. Boulder, Colorado USA: National Snow and Ice Data Center. Digital media. [https://nsidc.org/data/glacier_photo/search/image_info/southcascade2014101001].
The diagram below demonstrates how different glaciers would theoretically respond to warming conditions, and how this can be understood by looking at their ELAs. In part a, the glaciers are in balance with the climate and have ELAs denoted as ELA1. In part b, after climate warming begins, the ELAs for the glaciers move up from where they were before. In part c, the glaciers have adjusted to the climate in part b, and they have all lost mass. The small glacier has entirely melted here because the ELA migrated to a height above the glacier.
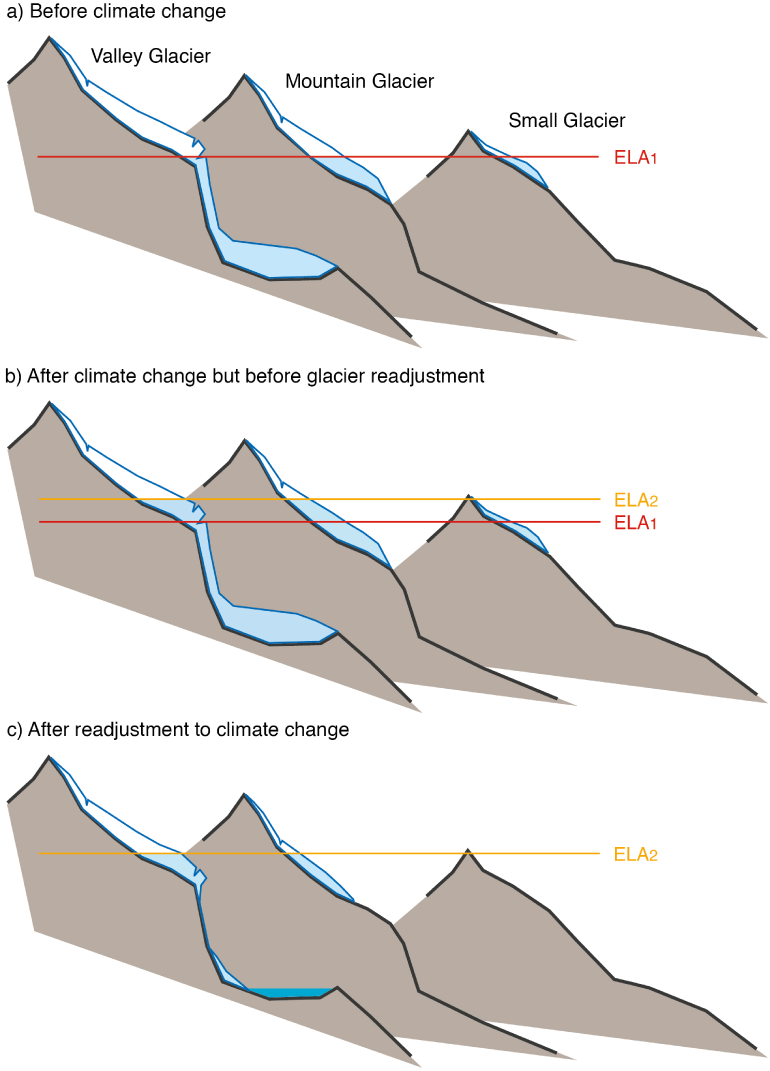
Graphic from Vaughan, D.G., J.C. Comiso, I. Allison, J. Carrasco, G. Kaser, R. Kwok, P. Mote, T. Murray, F. Paul, J. Ren, E. Rignot, O. Solomina, K. Steffen and T. Zhang, 2013: Observations: Cryosphere. In: Climate Change 2013: The Physical Science Basis. Contribution of Working Group I to the Fifth Assessment Report of the Intergovernmental Panel on Climate Change [Stocker, T.F., D. Qin, G.-K. Plattner, M. Tignor, S.K. Allen, J. Boschung, A. Nauels, Y. Xia, V. Bex and P.M. Midgley (eds.)]. Cambridge University Press, Cambridge, United Kingdom and New York, NY, USA.
Glacier Fun
Interactive
|
|
|
Videos
How do glaciers shape the landscape? from Oxford Education
Teacher Resources
|
|
|
||
|
|
Glaciers and Glacial Landforms, by the National Park Service |
|
|
|
|
|