A geologic map is a special-purpose map made to show geologic features. Geologic maps show the types and ages of rocks and younger deposits that are found at or near the Earth's surface. This fundamental tool for earth scientists, maps show map units, faults and folds, cross sections, and other regional or local features, depending on map scale. Map data is typically shown on a base map, which shows topography, water, and other landmarks.
Anatomy of a Geologic Map
- Map Units
- Faults and Folds
- Scale
- Cross Sections
- Base Maps
-
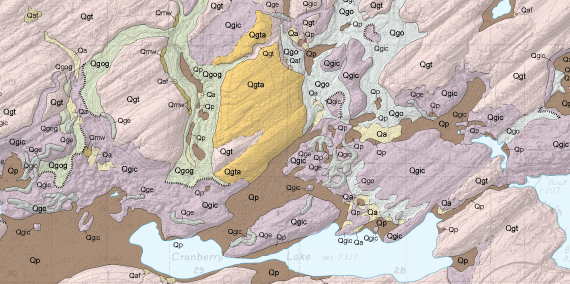
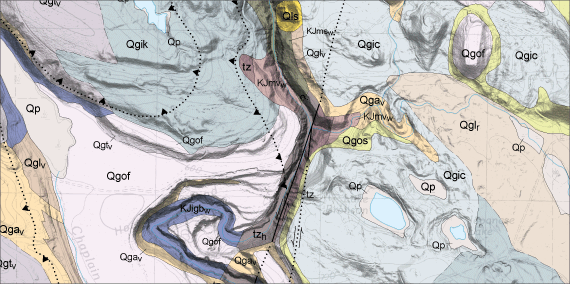
A geologic map classifies rocks and deposits into geologic map units, that are displayed as colored or patterned areas on the map based on unique rock type, age, or depositional setting.
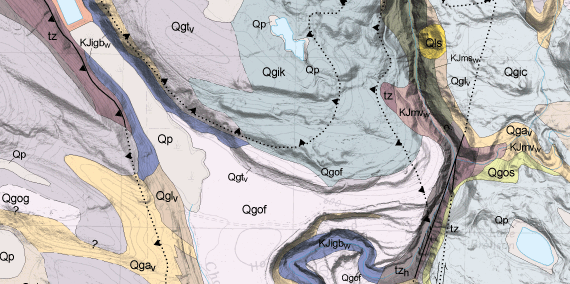
In this example, each colored polygon represents a geologic map unit. The unit symbols labelling each polygon signify the units' age, depositional setting, rock type, and formal or informal name. For example, the unit symbol "Qgtv" tells us that its age is Quaternary (less than about 2 million years old), it is composed of glacial (g) till (t), and is part of the Vashon Stade (v).
-
Geologic structures, such as faults and folds, are added to geologic maps to show where the Earth's crust has bent or broken.
Faults
Because of plate tectonics, formations that make up the Earth's crust are broken along faults. The past motion along faults can be measured from centimeters to kilometers depending upon the age and tectonic setting of the fault. Repeated movement along the fault pulverizes the surrounding rock, producing what is termed “fault gouge” by geologists.
Faults that break Quaternary deposits are considered potentially active or active, depending upon when the fault last moved. Active faults have the potential for rupture during earthquakes—many geologists do detailed study of these features to better estimate the frequency and magnitude of earthquakes along them.
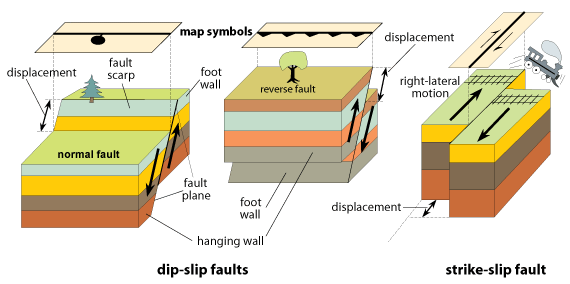
Faults can be classified into three major categories, based on their sense of displacement: normal, reverse, and strike-slip. Different map symbols are used to mark the different types of faults.
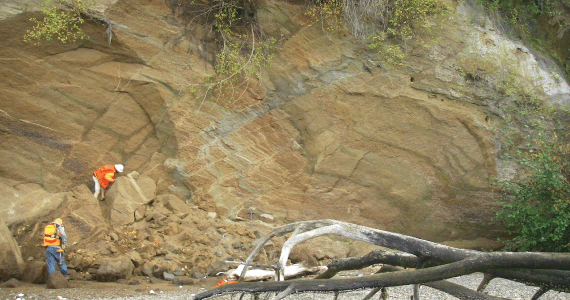
An beach-side outcrop of young unconsolidated deposits disrupted by a strand of the Dabob Bay fault zone, found recently on the western shore of the Toandos Peninsula, near Brinnon.
Folds
Folds are also commonly shown on geologic maps. A fold occurs when originally flat surfaces, such as sedimentary strata, are bent or curved as a result of tectonic movements. It is the trace of the “fold axis” of moderately large to large folds that are commonly displayed on geologic maps. These can be small folds that measure centimeters to meters across or can be so large, they may be viewed from space.
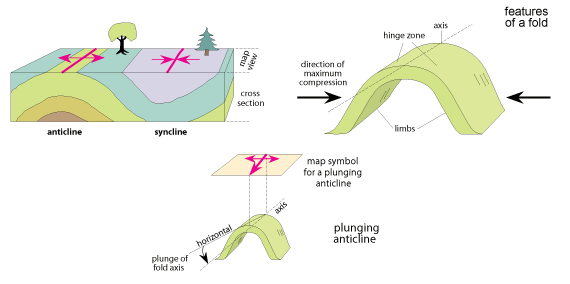
Geologists map the trace of the fold where it meets the Earth's surface.
-
Maps are made at varied scales. Map scale determines how much territory is shown by a map. For instance, at a scale of 1:100,000, one inch on the map equals 100,000 inches in the real world—about 1.6 miles.
In Washington State, common geologic map scales are 1:24,000, 1:100,000, and 1:250,000. All of Washington has been mapped at 1:100,000 and 1:250,000 scales, but most of the state remains unmapped at the more detailed 1:24,000 scale. Land owners, planners, decision-makers, and others commonly need information at 1:24,000, or even at a more detailed scale.
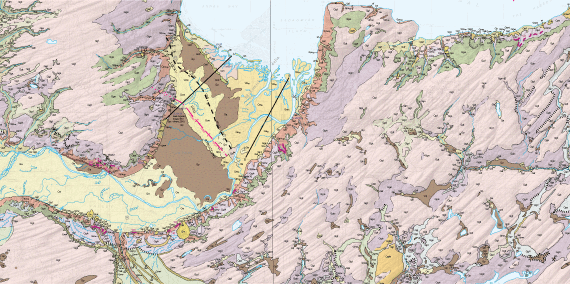
Use your mouse to hover over the photo to compare geologic mapping of the Skokomish–Union area in Mason County at various scales. The left map was mapped at 1:100,000 scale and the right map was created at 1:24,000 scale.
-
A geologic map can only show what is exposed at the surface of the Earth. To show what lays beneath our feet, geologists make cross sections. Cross sections are imaginary slices into the earth that show how rock units or deposits are arranged below the surface. Geologists use structural measurements, data obtained from water well or geotechnical borings, and various types of geophysical information to help determine the geometry of the geologic map units at depth.
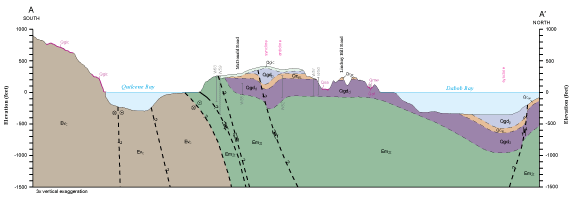
Geologists use surficial mapping, structural measurements of the orientations of rocks and faults, water well and geotechnical boring logs, seismic survey data, and various types of geophysical data to construct cross sections.
-
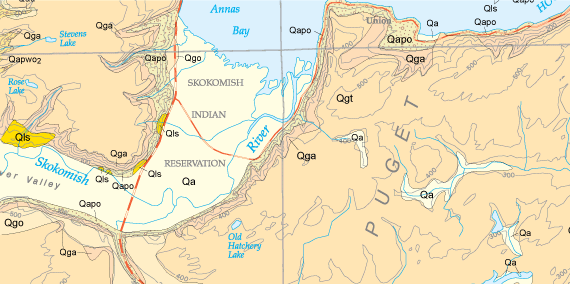
To make a geologic map, geologists start with a base map. A base map shows topography, streams, roads, settlements, landmarks, and sometimes land-use patterns like forestlands and urban areas. This geographic information provides the base that geologists use to map geologic units, faults, folds, and other surface geologic features. Commonly, geologists use the appropriately scaled topographic quadrangle maps made available by the U.S. Geological Survey.
Remote-sensing images also make useful base maps. There are many types of remote-sensing data, but probably the most useful are aerial photographs and lidar.
Lidar, which stands for Light Detection and Ranging, uses light in the form of a pulsed laser to measure the distance to the Earth from the airborne device. This relatively new remote-sensing method allows trees and other masking vegetation to be removed from the aerial image. Lidar is increasingly used along with topographic maps to more accurately locate features in the field and to aid the map user in 'reading' the relationship between the mapped geology and the terrain.

Use your mouse to hover over the photo to compare geologic maps with and without lidar. Lidar enhances the terrain readability—the steepness of the river channel and the identity of other geologic features instantly become obvious.
How are Geologic Maps Made?
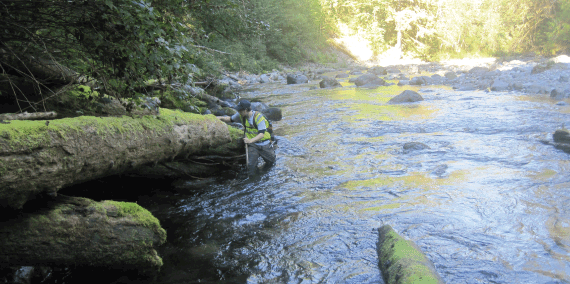
Geologists use a variety of tools to make a geologic map. Although technology, access, and modern plate tectonic and other scientific theories have revolutionized the creation of geologic maps, the basic process of field mapping has changed little. Geologists look for outcrops. Outcrops allow direct observation and sampling of the bedrock or unconsolidated deposits. In the heavily forested and vegetated areas of western Washington, high-quality outcrops can be hard to locate. The best outcrops are typically found along creeks and rivers, where erosion has exposed the underlying strata or layers. Outcrops are also found along steep road cuts, cliffs, or other escarpments such as coastal bluffs, where the soil is thin or completely eroded away and large areas of the geologic map units are exposed.
By studying the geology exposed at many outcrops and then piecing together this geologic information, a geologic map is incrementally produced. The data and observations obtained from the various outcrops are supplemented by subsurface information gained by digging or boring (for example, using a geopick or backhoe), geophysical analyses (for example, gravity, magnetic, seismic data sources) and other data, such as water, geotechnical, or oil and gas well records.

DNR geologists Trevor Contreras and Jack Powell mapping basalt stratigraphy in Lincoln County.
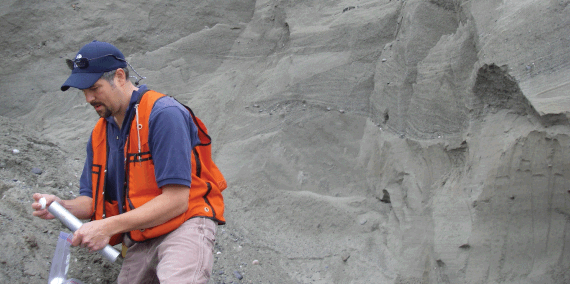
WGS geologist Jessica Czajkowski examining pre-Vashon nonglacial deposits exposed along the South Fork of the Skokomish River.
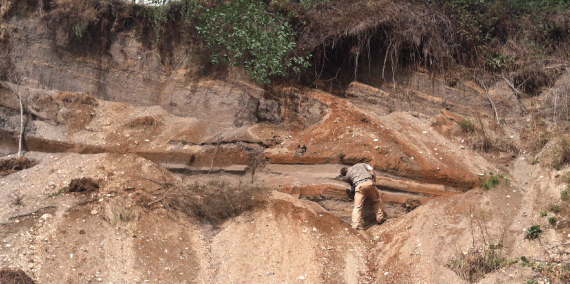
Former WGS geologist Joe Dragovich exploring a massive outcrop of a glacial delta complex near Lake Chaplain.
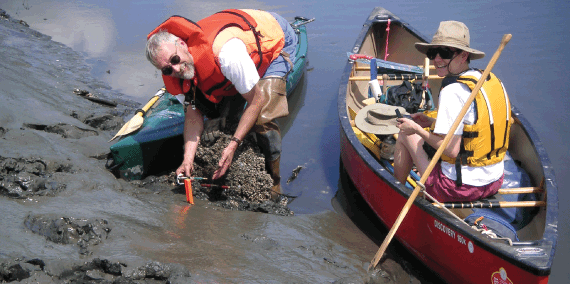
Former DNR geologists P. Pringle and S. Magsino sampling wood from submerged stump recording paleoseismic subsidence along Puget Sound.
WGS geologist Trevor Contreras sampling sand from a pre-Vashon sand deposit near Lofall.
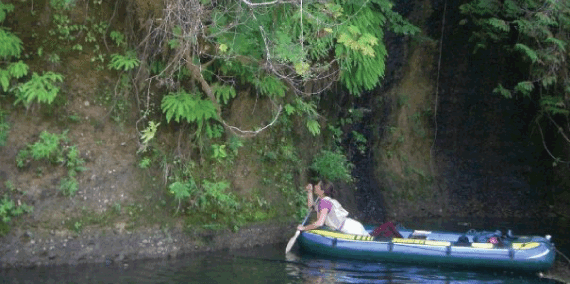
Because there is so much vegetation west of the Cascades, finding outcrops sometimes requires a bit of creativity (and extra clothes).
How are Geologic Maps Used?
Geologic maps have many uses and practical applications, including growth-management planning, transportation, dam safety, hazard and risk assessment, Puget Sound cleanup and restoration, water resource appraisals, resource use and protection, education, recreation, and scientific research. Geologic maps can also be used to find minerals, water, sand and gravel, and energy resources. Planners and engineers use geologic maps to identify geologic hazards, like landslides and faults, and to manage urban growth. Rock hounds use geologic maps to help find rare or interesting rocks, minerals, or fossils.
Virtually every Environmental Impact Statement (about 50 each year) begins with a geologic map. Without our maps, EIS originators would be required to generate their own information at significant cost. Stormwater runoff mitigation may be based on geologic mapping by identifying permeable rock into which storm water can be drained, thus preventing frequent flooding.
What We Do
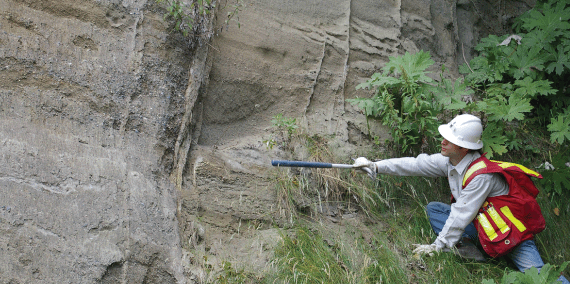
WGS geologist Michael Polenz pointing to a shear found in a coastal bluff in the Hansville area within the southern Whidbey Island fault zone. Photo credit: Brad Peterson.
Our job as the state geological survey is to produce maps that cover large areas of the state at various scales. We compile mapping done by others and add our own mapping to complete the coverage. New geologic maps are sometimes needed in areas already mapped because older maps did not benefit from important new insights and technologies. The Survey is constantly working on new geologic maps to provide up-to-date geologic information to the public.
Get Our Maps
Geologic Maps
Vist our Washington State Geologic Map application to find surface geology maps throughout the state. Use the interactive filter and search tools to find geologic maps based on location and scale.

KMZ files for Google Earth
One way to view geologic data is with a KMZ file which can be opened in Google Earth.
Click on the map below to download 1:100,000-scale geologic map KMZ files for use in Google Earth.
Instructions for KMZ Files
Download the instructions, or watch the following YouTube video:
Depth to bedrock model
Click the image below to download Models of bedrock elevation and unconsolidated sediment thickness in the Puget Lowland, Washington. This was compiled and interpreted from previous publications on the subject, well logs, geotechnical data, seismic surveys, and geologic mapping.
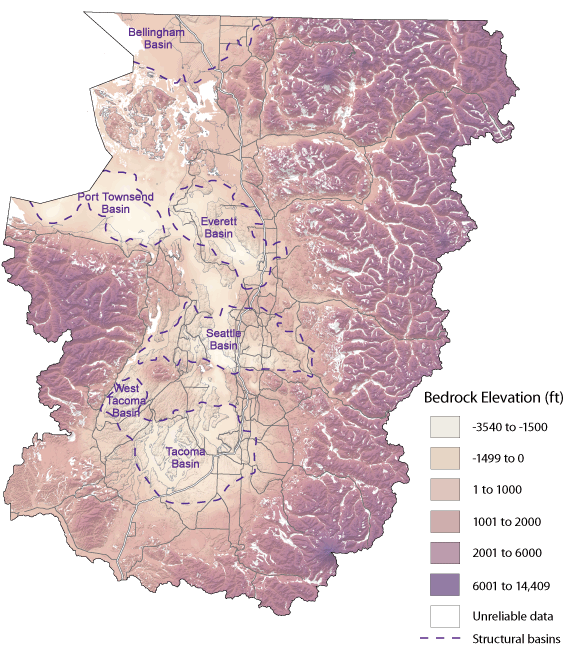
Bedrock elevation map of the Puget Lowland, showing major structural basins.
Geologic Maps of Other Scales and Other Geologic Data
Please visit our Publications Catalog, Publications and Maps page, Geologic Information Portal, or GIS Data and Databases page for additional maps and data.
 |
|
 |
Geologic Thin Section and Field Notebook Collection
|
The Washington Geological Survey hosts a large collection of digital versions of physical items and documents, including scanned thin sections (slices of rock mounted on slides), field notebooks, coal mine maps, and historical photos. Check out the thin section collection and field notebook collection on our Data Preservation Website to learn more.
|
 |